Investboard …
KnowledgeStrategy & portfolio
Is this time different?
Distinguishing technological miracles from financial follies: what railway mania, radio and the dot-com boom reveal about AI investment returns. What past technology booms reveal about the AI bubble debate.
In short
AI can transform the economy without rewarding every investor who finances it. Railway mania, radio and the dot-com boom show why adoption and social value are different from shareholder returns. The relevant tests are value capture, durable margins, capital intensity, depreciation, financing and the price paid for future cash flows.
A useful technology can create enormous social value while its investors lose money.
Competition and overbuilding determine how much value suppliers retain.
Additional key points
AI accelerators can become economically obsolete much sooner than railway bridges or fibre.
Assess cash flows, incremental returns on capital and leverage rather than the narrative alone.
In short
AI can transform the economy without rewarding every investor who finances it. Railway mania, radio and the dot-com boom show why adoption and social value are different from shareholder returns. The relevant tests are value capture, durable margins, capital intensity, depreciation, financing and the price paid for future cash flows.
A useful technology can create enormous social value while its investors lose money.
Competition and overbuilding determine how much value suppliers retain.
AI accelerators can become economically obsolete much sooner than railway bridges or fibre.
Assess cash flows, incremental returns on capital and leverage rather than the narrative alone.
Is AI a bubble, or a technological revolution? Many of the technologies that reshaped modern civilization were accompanied by extraordinary financial booms.
Railways transformed nineteenth-century commerce while destroying fortunes. Electrification, automobiles, and radio changed daily life even as the speculative excesses of the 1920s ended in financial collapse. The internet fulfilled almost every promise made about it while many of the companies and investors financing its first great build-out disappeared.
Artificial intelligence may prove to be another version of the same paradox.
The mistake is not believing that a new technology will matter. Investors are often right about that. The mistake is assuming that technological importance, social value, corporate profitability, and shareholder returns are the same thing.
They are not.
A technology can generate enormous consumer surplus while producing disappointing returns on invested capital. Infrastructure can be essential to the next economic era and still be dramatically overbuilt. An industry can grow exponentially while competition transfers most of the value it creates to customers rather than shareholders.
This distinction, between value creation and value capture, is the central problem of every technology boom.
The historical record suggests a recurring pattern. A genuine breakthrough attracts capital. Early success encourages extrapolation. Financing expands. Capacity is built ahead of demand. Competition compresses returns. Eventually, expectations collide with cash flows.
Sometimes the result is merely a stock-market correction. When leverage and maturity mismatch become large enough, the adjustment can spread into the financial system.
Yet the crash rarely destroys the underlying technology. Railways remain. Power grids remain. Fiber remains.
The investors may disappear while the infrastructure becomes civilization.
That is the lens through which the current AI investment boom should be evaluated.
The important question is therefore not simply:
Is AI a bubble?
A better question is:
Who will capture the economic rents generated by AI, how much capital will be required to capture them, and what returns will that capital ultimately earn?
The observer’s lens
Studying economics at Masaryk University between 2010 and 2015 meant learning the subject in the aftermath of one of the most consequential financial crises in modern history.
The 2008 crash had weakened confidence in simple models of efficient, self-correcting markets. The European sovereign-debt crisis was unfolding across the continent. Banks were being recapitalized, governments were imposing austerity, and unconventional monetary policy was moving from academic discussion into everyday economic policy.
Economic history suddenly felt less like history.
One question kept returning:
Why do sophisticated markets repeatedly build, rationalize, and then destroy speculative booms?
Carmen Reinhart and Kenneth Rogoff's This Time Is Different documented the remarkable consistency with which financial actors convince themselves that old constraints no longer apply. Hyman Minsky explained how periods of stability can themselves encourage increasingly fragile financing structures. Charles Kindleberger showed how technological or economic displacement can evolve into speculation, mania, distress, and panic.
Carlota Perez added another crucial insight: financial excess and technological progress are not always opposites. Speculative capital can finance the installation of infrastructure that later becomes economically indispensable, even if the investors who funded the first wave earn poor returns.
That distinction matters enormously today.
Artificial intelligence is already producing real technological capabilities. The debate is no longer about whether machines can generate useful software, text, images, research, analysis, or autonomous workflows. The relevant economic question is different:
How much of the value created by those capabilities can the companies financing them actually retain?
That leads to the central paradox of technological investing.
The core paradox: social surplus vs. investor returns
A transformative technology can create value in at least two fundamentally different ways.
The first is social surplus: lower prices, better products, greater productivity, new capabilities, improved access, and entirely new markets.
The second is producer surplus: profits retained by the companies supplying the technology and ultimately available to shareholders.
Those two outcomes can diverge dramatically.
Competition often makes successful technologies cheaper, more accessible, and more interchangeable. That is excellent for society. It is not automatically excellent for producers.
As technologies mature:
- unit costs can decline;
- alternative suppliers emerge;
- capabilities diffuse;
- customers gain bargaining power;
- prices move toward marginal cost;
- previously scarce capabilities become commodities.
The result can be an extraordinary economic technology with ordinary, or even poor, economics for many of its suppliers.
The historical question is therefore not simply whether a technology transforms civilization.
It is whether investors paid a price that allowed them to participate in that transformation profitably.
Technological truth and investment truth are related, but they are not identical.
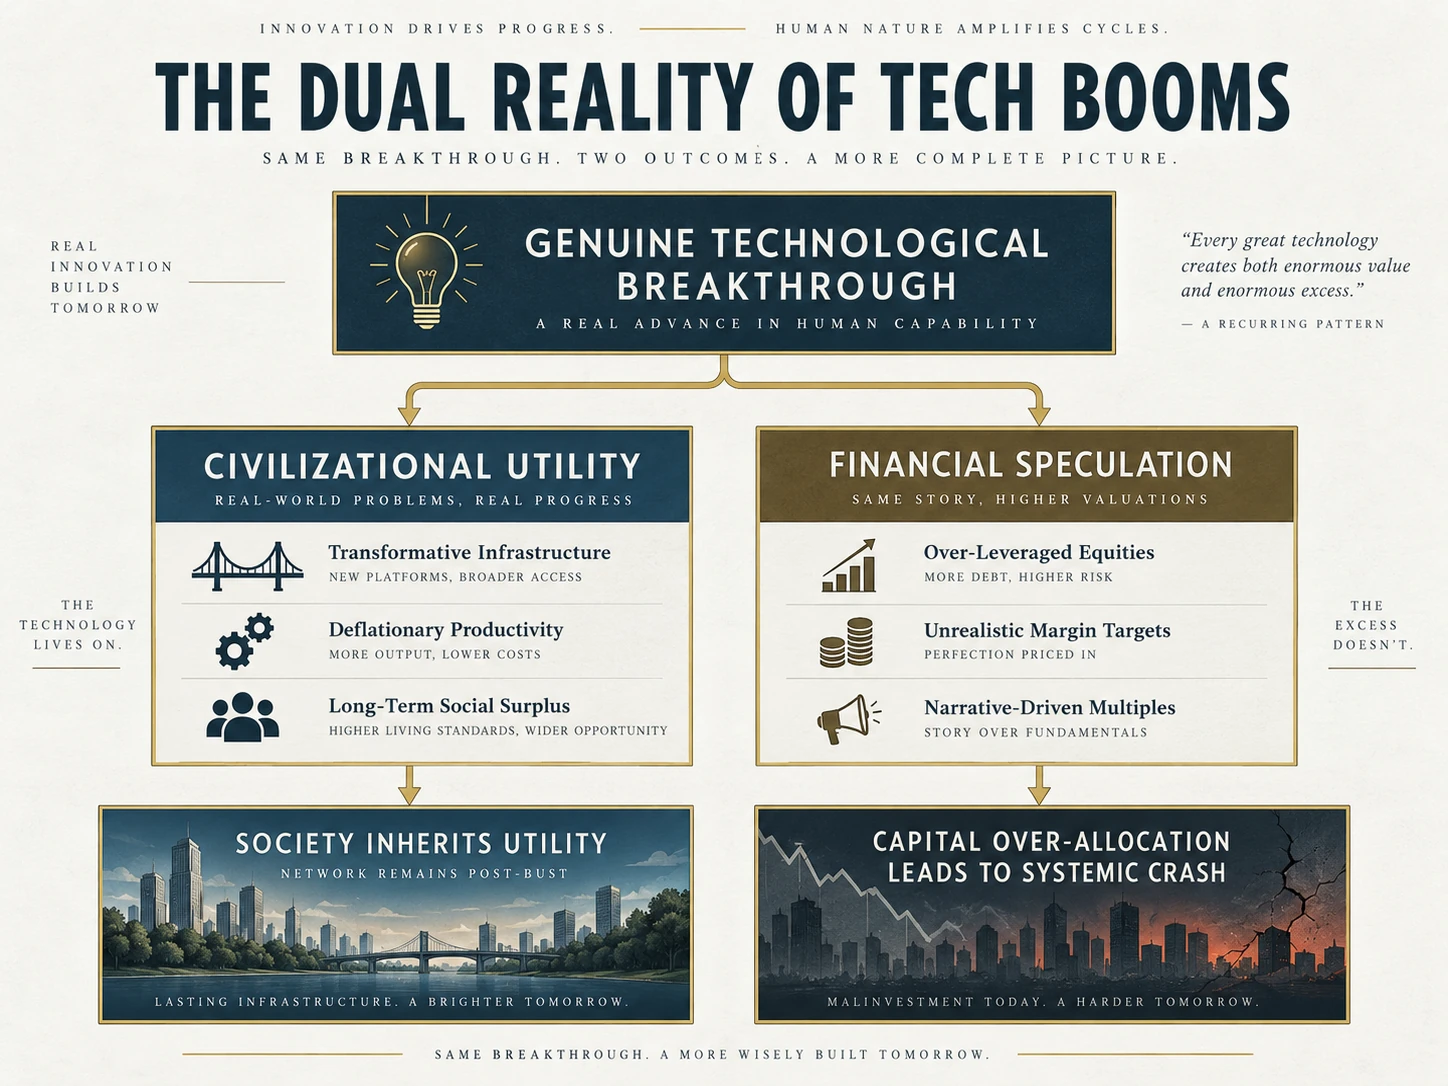
Figure 1: The dual reality of tech booms. A real breakthrough can create useful infrastructure while investors overpay for the businesses supplying it. A systemic crash is a possible outcome when financing is fragile, not an inevitable result of innovation.
Open full-size figure (new tab)Railway mania: the British build-out
The miracle: railways
Few technologies demonstrate the distinction better than the railway.
Before railways, transportation costs fragmented markets. Heavy goods moved slowly. Perishable products faced narrow geographic markets. Travel between cities was expensive and unreliable.
Railways changed the economic geography of Britain.
They connected industrial centers to ports, reduced transport costs, accelerated the movement of people and goods, expanded labor markets, and helped turn regional economies into a more integrated national market.
The technological achievement was real.
So was the financial mania.
The bubble mechanics: railways
During the mid-1840s, railway promotion exploded across Britain.
Parliament was overwhelmed with proposals requiring legislative authorization. Its historical overview records more than 700 railway Bills introduced in 1846 and 8,590 miles authorised across 1845–1847, an extraordinary expansion relative to the existing network. UK Parliament: Fire and steam.
Capital structures helped amplify the boom.
Investors subscribing to railway shares frequently paid only part of the promised capital upfront. Railway companies could later issue additional calls requiring subscribers to provide the remainder.
During rising markets, this structure increased purchasing power.
During falling markets, it created a problem.
Investors who had committed capital to multiple railway schemes suddenly faced simultaneous calls for cash precisely when credit conditions were tightening and railway share prices were declining.
The system contained an embedded form of leverage.
The boom therefore combined three ingredients that will appear repeatedly throughout financial history:
a real technological breakthrough, extrapolated demand expectations, and financing structures that magnified the consequences of being wrong.
As monetary conditions tightened in 1847 and confidence weakened, many railway projects collapsed or were abandoned.
Investors suffered substantial losses.
But Britain did not lose the railway.
What remained: railways
The physical infrastructure survived the financial excess.
Railway construction continued through the downturn, frequently under new ownership or at lower valuations. By the late 1840s the network had expanded dramatically, and the infrastructure created during the speculative period formed part of Britain's transportation system for generations.
This is the first recurring lesson:
A speculative boom can misallocate financial capital while simultaneously creating socially valuable infrastructure.
The railway shareholders and the railway economy did not experience the same outcome.
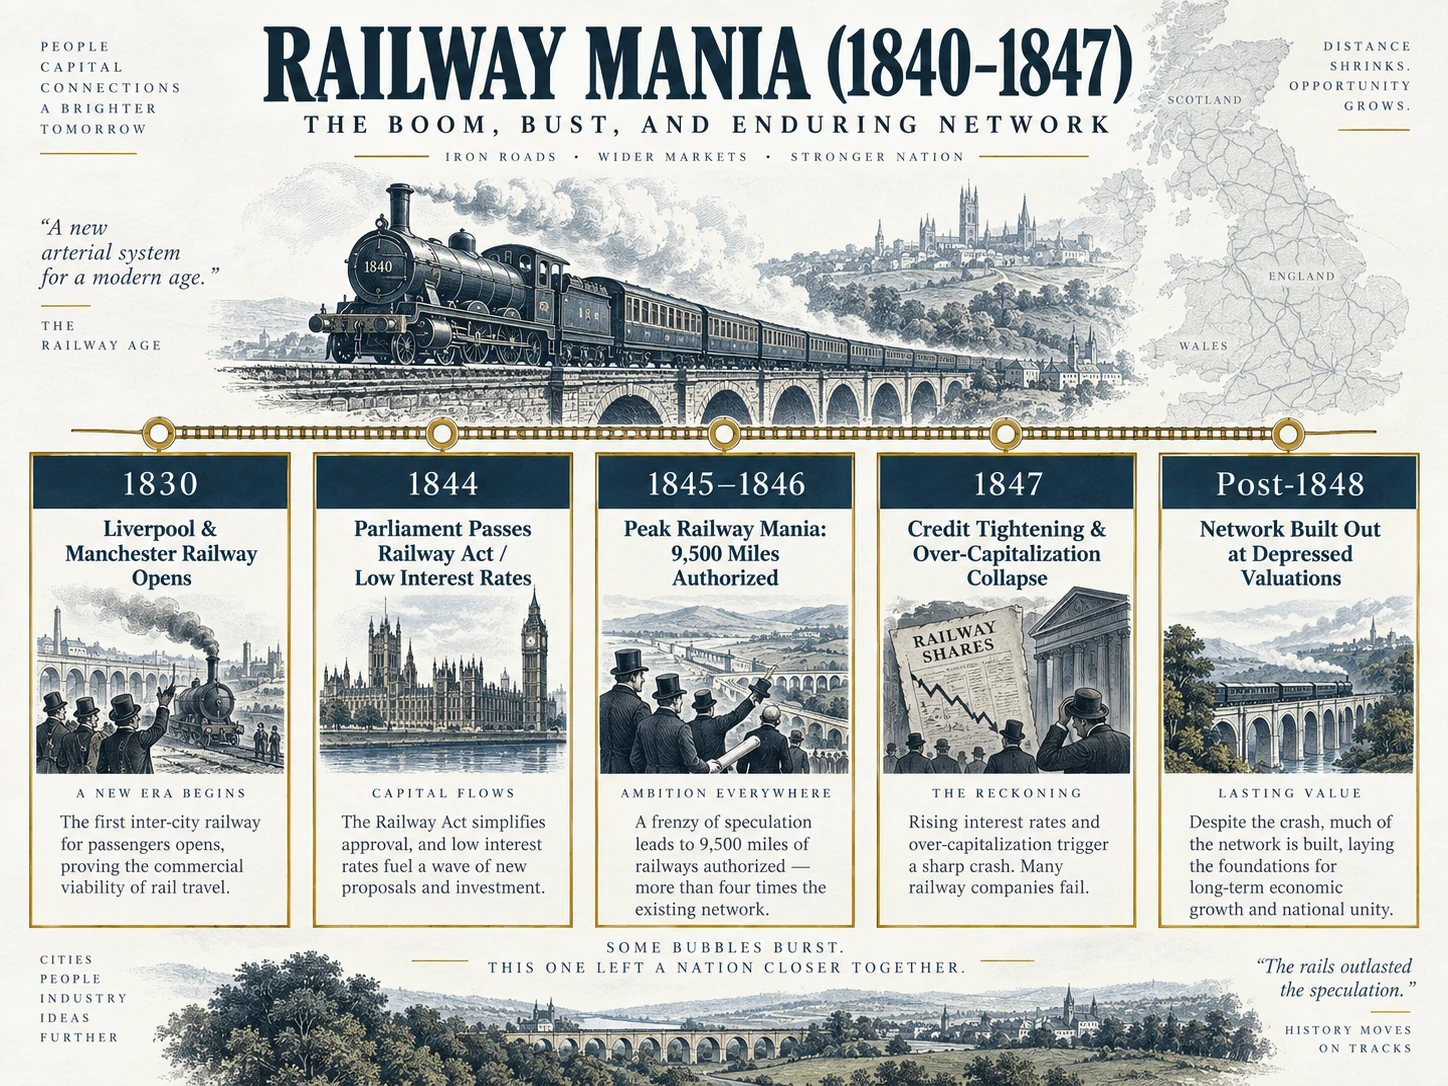
Figure 2: Railway mania: boom, bust and the enduring network. The graphic gives 9,500 miles without a consistent period or definition. The parliamentary history linked in the text records 8,590 miles authorised in 1845–1847. Read the illustration as a timeline, not a statistical source; the 1844 Act also imposed service conditions and was not simply an approval shortcut.
Open full-size figure (new tab)Electricity, automobiles and radio in the 1920s
The miracle: the 1920s
The 1920s brought several general-purpose technologies into commercial maturity at roughly the same time.
Electricity spread through factories and households.
Assembly-line production made automobiles accessible to millions of consumers.
Radio created the first mass electronic media market.
Telephone networks expanded.
Consumer appliances began changing domestic life.
New industries appeared around these technologies, and productivity improved as factories redesigned production around electric machinery rather than merely replacing steam engines one-for-one.
The transformation was profound.
Investors noticed.
The bubble mechanics: the 1920s
One of the era's most famous symbols was the Radio Corporation of America.
RCA represented more than a company. It represented the future.
Radio promised to connect households across the continent. Broadcasting appeared capable of creating entirely new advertising, entertainment, and communications industries.
RCA became one of the clearest examples of a company embodying a technological narrative. Finaeon's historical price research records a five-for-one split in March 1929, a September peak of $114.75 and a May 1932 low of $2.50: a decline of roughly 98%. Comparing the earlier prices requires care with the split. Finaeon: RCA and the Roaring Twenties.
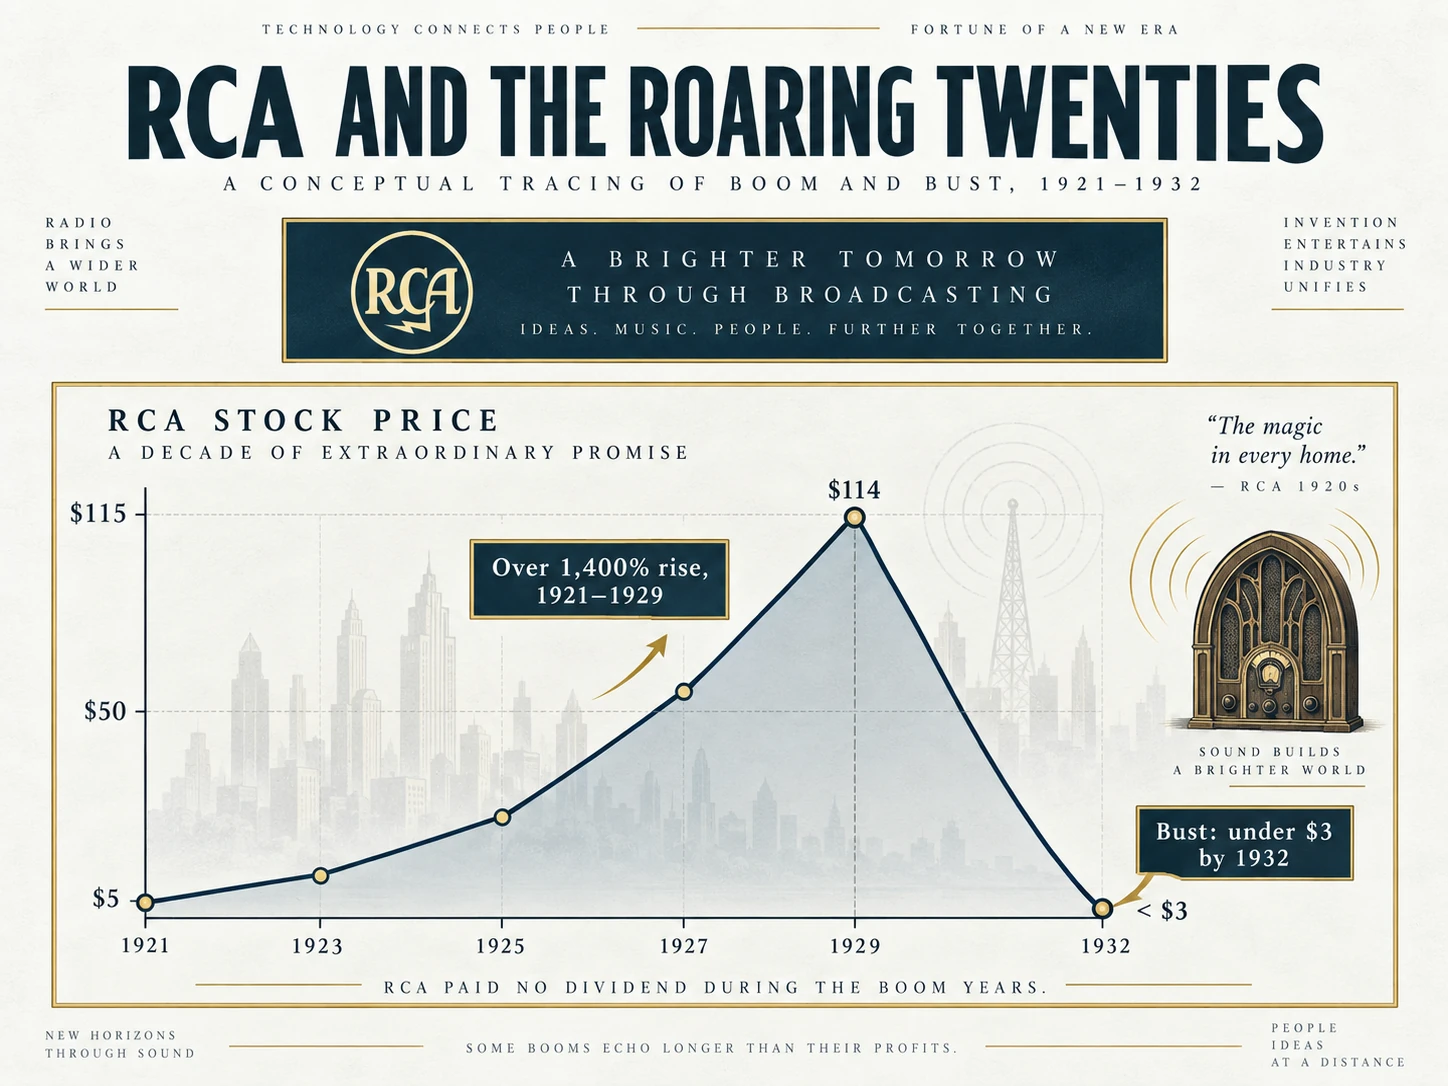
Figure 3: RCA and the Roaring Twenties. This is a conceptual tracing, not an investable price series. Its intermediate points and 1,400% label should not be used to calculate returns. The historical source reports a five-for-one 1929 split, a $114.75 peak and a $2.50 low in 1932.
Open full-size figure (new tab)But equity speculation was only one part of the problem.
Utility companies also built increasingly complex holding-company structures. Debt and preferred securities were layered through corporate chains. Meanwhile, margin financing allowed investors to purchase equities with borrowed money.
By 1929, brokers' loans had reached extraordinary levels.
The resulting vulnerability was not simply that shares had become expensive.
It was that expensive assets increasingly sat on top of fragile financing structures.
When asset prices began falling, leverage accelerated the adjustment.
The crash was not the technology
The collapse of 1929 did not prove that electricity was useless, automobiles were a fad, or radio had been overhyped as a communications technology.
All three went on to transform the twentieth century.
Nor should the stock-market crash itself be treated as the sole cause of the Great Depression. Banking failures, monetary contraction, policy errors, international debt problems, and the rigidities of the gold standard turned a market collapse into a much deeper economic catastrophe (Temin, 1989; Eichengreen, 1992).
Again, the distinction matters:
The technology survived. The capital structure did not.
Power grids, factories, roads, telephone lines, automotive manufacturing capacity, and communications networks became part of the productive base of the postwar economy.
The second lesson follows:
Financial failure does not imply technological failure.
Telecom and the dot-com boom
The miracle: the internet
The commercial internet may be the best modern example of investors being simultaneously right about the future and wrong about the price.
The browser transformed access to information.
Fiber-optic communication dramatically expanded network capacity.
Data transmission costs fell.
Software distribution changed.
Entirely new businesses became possible.
The underlying technological thesis was not merely correct.
It was understated.
The internet ultimately transformed retail, advertising, software, entertainment, payments, logistics, communications, media, labor markets, and financial services.
But investors paid for that future long before the economics of many companies could support their valuations.
The bubble mechanics: the internet
During the late 1990s, traditional valuation frameworks increasingly gave way to metrics designed specifically for companies that had little revenue and no earnings.
Investors discussed:
- page views;
- registered users;
- eyeballs;
- clicks;
- traffic growth;
- addressable markets.
The assumption was that monetization would eventually follow scale.
Sometimes it did.
Frequently it did not.
Meanwhile, telecommunications companies financed an enormous infrastructure expansion.
Fiber-optic networks were built for demand expected many years into the future. Contemporary estimates suggested that a very large share of newly installed fiber capacity remained unused during the immediate aftermath of the boom.
The causal sequence was familiar:
cheap capital → aggressive investment → excess capacity → price competition → weaker economics → insolvency.
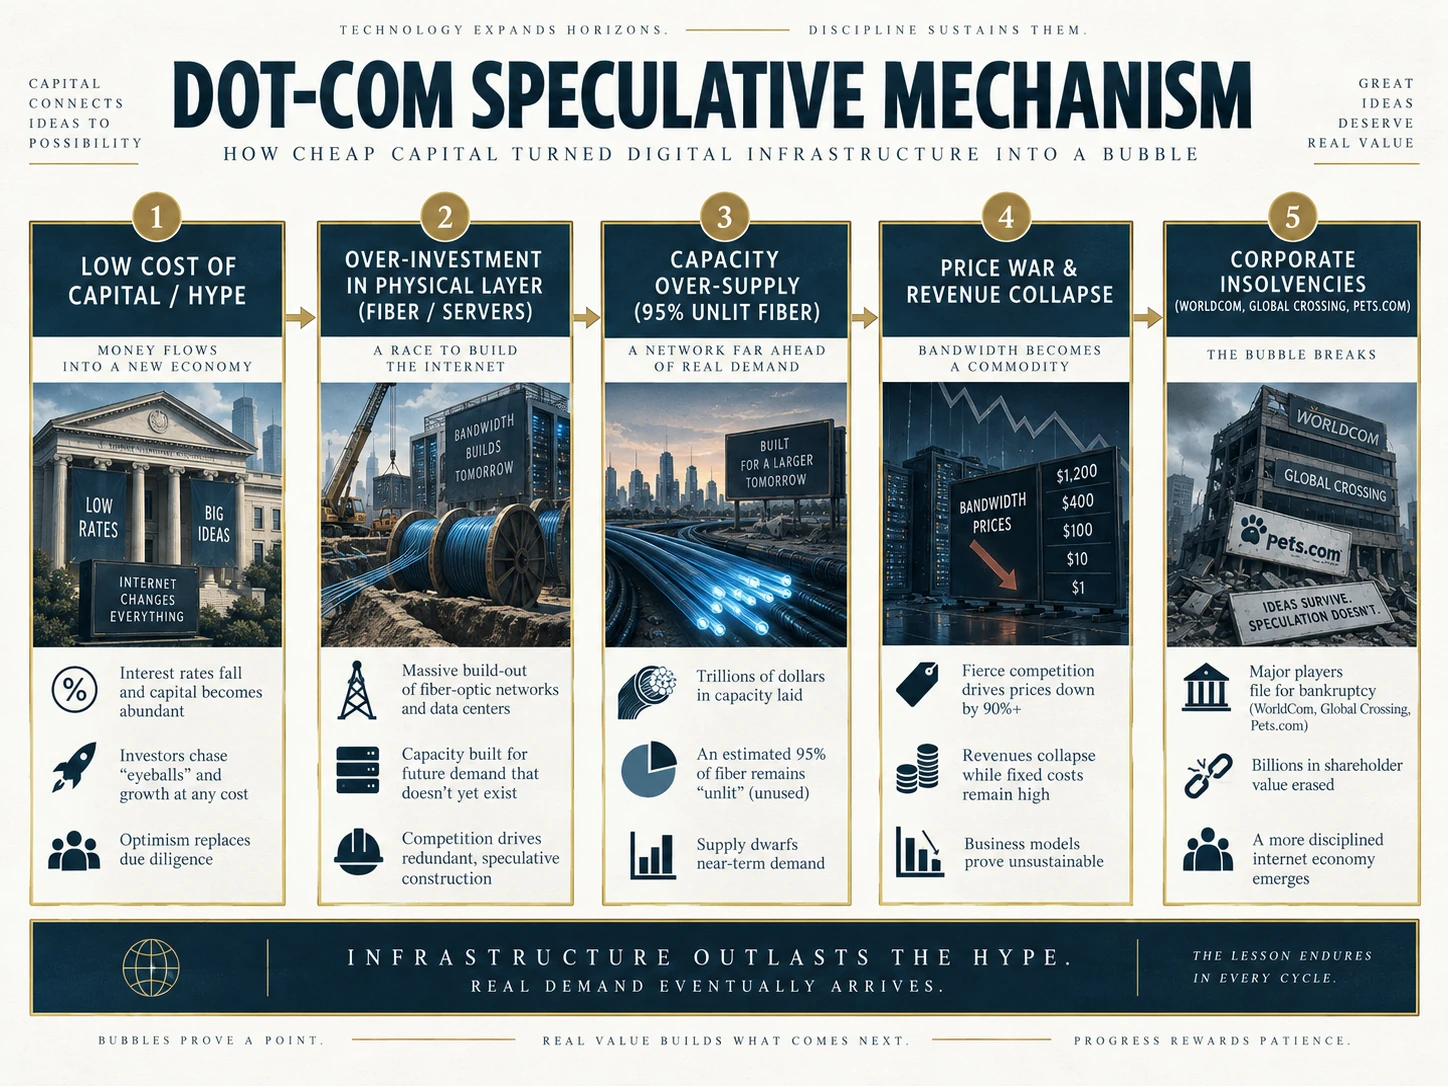
Figure 4: The dot-com speculative mechanism. Abundant capital can build capacity faster than demand and intensify price competition. The graphic’s 95% unused-fibre estimate and price ladder lack a defined dataset and period; they are not used as evidence in this article. Pets.com was an online retailer, unlike the telecom network operators WorldCom and Global Crossing.
Open full-size figure (new tab)The Nasdaq-100 eventually lost more than 80% as the dot-com bubble burst. Nasdaq records an 83% decline.
Companies disappeared.
Telecommunications balance sheets broke.
WorldCom and Global Crossing collapsed.
Yet the internet did not.
What remained: the internet
The fiber remained underground.
Data centers remained.
Servers remained.
Engineering knowledge remained.
Network equipment remained.
And the marginal cost of moving information continued to decline.
Infrastructure originally built under unrealistic financial assumptions could be purchased after bankruptcy at much lower economic cost.
That helped create better economics for the businesses built on top of it.
Search.
Cloud computing.
Streaming.
Social networks.
Mobile applications.
Software-as-a-service.
Online marketplaces.
The financial bubble had helped finance the installation layer of the next economic system.
Perez describes this transition as the movement from an installation period, characterized by experimentation and speculative capital, toward a deployment period, in which the technology becomes embedded across the wider economy.
The third lesson is perhaps the most important:
Overinvestment can destroy capital for investors while reducing the cost of innovation for everyone who comes afterward.
The pattern across technological revolutions
The historical parallels are not perfect.
They should not be.
Railways are not fiber networks. Fiber networks are not GPUs. A semiconductor has a very different depreciation curve from a railway bridge.
What matters is not superficial similarity but recurring economic structure.
| Feature | Railway Mania | 1920s Technology Boom | Dot-Com / Telecom | Generative AI |
|---|---|---|---|---|
| Core asset | Railways | Power grids, factories, roads | Fiber, servers, network equipment | GPUs, data centers, power, networks |
| Economic promise | Integrated markets | Mass industrial productivity | Global digital connectivity | Cognitive automation and augmentation |
| Speculative mechanism | Railway subscriptions and calls | Margin debt and leveraged holding companies | Equity speculation and telecom debt | Hyperscaler capex, venture capital, private credit and project finance |
| Main investor assumption | Traffic growth | Permanent growth and market dominance | Users first, profits later | Rapid utilization and monetization of compute |
| Primary competitive risk | Duplicate routes | Excess capacity | Bandwidth commoditization | Model and inference commoditization |
| Asset duration | Decades | Decades | Often decades | Much shorter at the chip level |
| Potential residue after excess | National rail network | Electrified economy | Global digital backbone | Compute, power and data-center infrastructure |
| Key uncertainty | Demand vs. planned mileage | Sustainable earnings vs. leverage | Monetization vs. installed capacity | Who captures AI rents relative to capital invested |
There is one particularly important difference in the AI cycle:
the infrastructure depreciates faster.
Rail tracks can remain useful for generations.
Fiber installed in the 1990s could remain economically useful long after the original owner went bankrupt.
Leading AI accelerators may become economically obsolete within only a few years.
That compresses the period in which the owner must generate an acceptable return.
A railway overbuilt five years early can still become productive.
A GPU cluster overbuilt five years early may be technologically obsolete by the time the demand arrives.
That changes the economics considerably.
How technology bubbles form
There is no single universal bubble taxonomy.
But the work of Minsky and Kindleberger provides a useful synthesis.
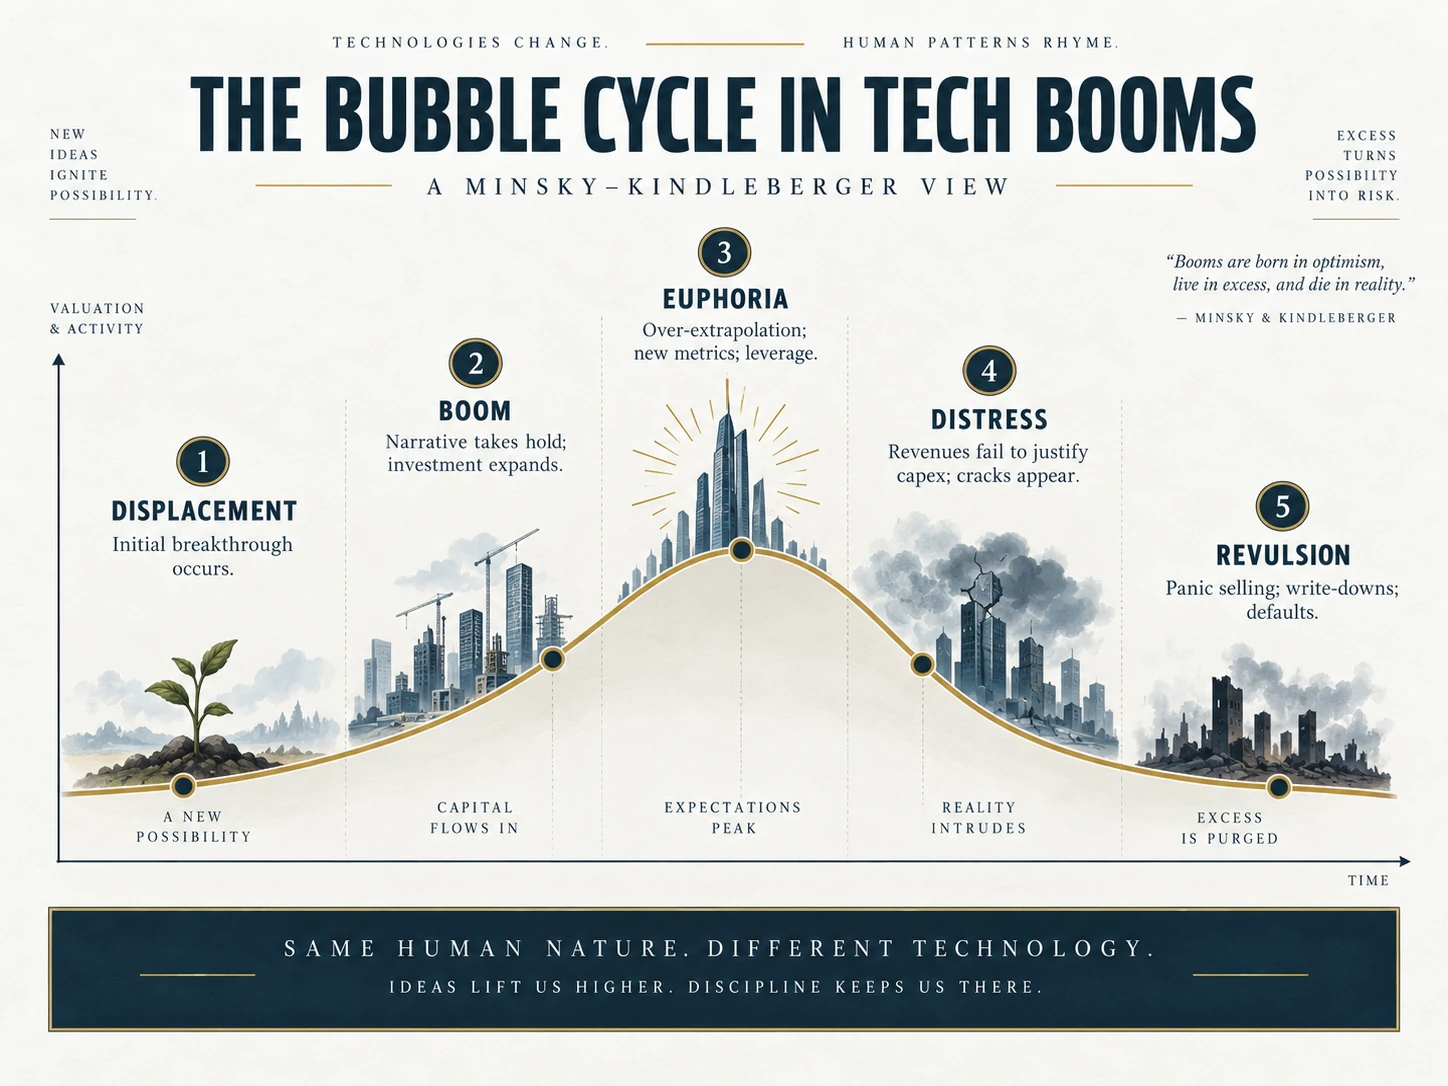
Figure 5: The bubble cycle in technology booms. A conceptual Minsky–Kindleberger framework, not a measured price chart or a forecast. The essay separates financing and competition more explicitly than this five-stage illustration. The attributed sentence inside the artwork is an editorial paraphrase, not a verified quotation.
Open full-size figure (new tab)Phase 1: displacement
A genuine breakthrough occurs.
The technology solves problems that could not previously be solved economically.
Early users achieve impressive results.
The opportunity is real.
This is important because the strongest bubbles are often built around something genuinely transformative.
Phase 2: extrapolation
Investors observe early success and extend the growth curve far into the future.
Temporary scarcity is treated as permanent scarcity.
Early margins are treated as normalized margins.
Market leaders are assumed to remain market leaders.
Total addressable market replaces discounted cash flow as the dominant language of valuation.
The argument gradually changes from:
"This technology will be important."
to:
"Therefore almost any price is justified."
Those statements are not equivalent.
Phase 3: financial acceleration
Capital follows returns.
Equity issuance expands.
Debt becomes easier to obtain.
Venture funds raise larger vehicles.
Project financing grows.
Financial intermediaries develop increasingly specialized structures to fund the boom.
The crucial distinction is that leverage is not necessary to create a valuation bubble.
But leverage determines how dangerous the eventual correction can become.
An equity financed at an absurd valuation can lose 80% without destabilizing the banking system.
An overvalued asset financed with short-duration debt can create forced selling, defaults, collateral problems, and financial contagion.
Valuation determines how far an asset can fall. Leverage influences how far the damage can spread.
Phase 4: overbuilding and competition
Capital abundance produces capacity.
Then capacity produces competition.
The very act of financing every participant can undermine the returns expected by all participants.
New entrants attack incumbent margins.
Customers negotiate better terms.
Prices fall.
Technology improves.
What was scarce becomes abundant.
This is where social surplus and producer surplus can diverge most dramatically.
The technology becomes better for customers precisely because its economics become worse for suppliers.
Phase 5: the cash-flow test
Eventually expectations must become cash flows.
Infrastructure needs utilization.
Debt requires servicing.
Assets require depreciation.
Equity requires returns.
At this stage the market stops asking:
"How big could this become?"
and begins asking:
"What return does this capital actually earn?"
If the answer is inadequate, valuations adjust.
If leverage is moderate, the result may be a painful but contained repricing.
If leverage is high and funding is fragile, a financial correction can become a financial crisis.
Is AI a bubble? Applying the historical lens
This is where historical analogy becomes useful, and dangerous.
AI clearly shares characteristics with earlier technology booms.
But declaring it "another dot-com bubble" would be intellectually lazy.
The correct approach is to identify both the similarities and the differences.
The scale of the build-out
The capital commitment is enormous.
Earlier 2026 guidance from Microsoft, Alphabet, Amazon and Meta already pointed to combined capital commitments above $600 billion. These are dated company-wide plans, not a measurement of AI-only spending or a like-for-like industry total.
Alphabet's February outlook put 2026 capital expenditure at $175–185 billion. Meta's initial annual outlook was $115–135 billion. Microsoft subsequently discussed roughly $190 billion for calendar 2026, while Amazon's initial plan was about $200 billion across the company. Guidance can change, accounting definitions differ, and not every dollar is exclusively AI. The figures establish the scale of the physical investment rather than a precise current AI spending total.
Sources: Alphabet's 2025 Q4 call, Meta's 2025 annual report, Microsoft's FY2026 Q3 call, and Amazon's initial 2026 outlook.
The infrastructure extends beyond GPUs.
It includes:
data centers, networking equipment, power generation, grid connections, cooling systems, land, fiber, memory, specialized chips, backup generation, and increasingly energy infrastructure designed specifically around large compute clusters.
AI has therefore crossed an important threshold.
It is no longer merely a software investment cycle.
It has become a major physical capital cycle.
But the revenue side is real too
This is where simplistic bubble comparisons fail.
AI is already generating material revenues.
Amazon reported that its AWS AI business exceeded a $25 billion annual revenue run rate in its second-quarter 2026 release. A run rate annualizes a recent pace; it is not revenue already earned over a full year. Organizational adoption is rising quickly rather than stagnating. Amazon Q2 2026 results.
Stanford's 2026 AI Index reports that 88% of surveyed organizations were using AI in some form by 2025. That survey result is not a census of all businesses. The same report estimates U.S. consumer surplus from generative AI at approximately $172 billion annually by early 2026. This is estimated value to users, not supplier revenue. Stanford AI Index 2026: Economy.
Those numbers matter.
They demonstrate why simply comparing infrastructure capex with a narrow estimate of standalone "AI software revenue" is misleading.
Hyperscaler infrastructure supports AI services, traditional cloud workloads, advertising systems, recommendation engines, internal productivity, search, and future services that may not yet be separately reported.
There is no clean accounting line called "return on AI."
The correct question is therefore not whether current AI revenue equals current infrastructure spending dollar for dollar.
Capital expenditure creates assets used over several years.
The relevant question is whether the present value of incremental lifetime cash flows, discounted at an appropriate cost of capital, exceeds the required investment.
That remains unresolved.
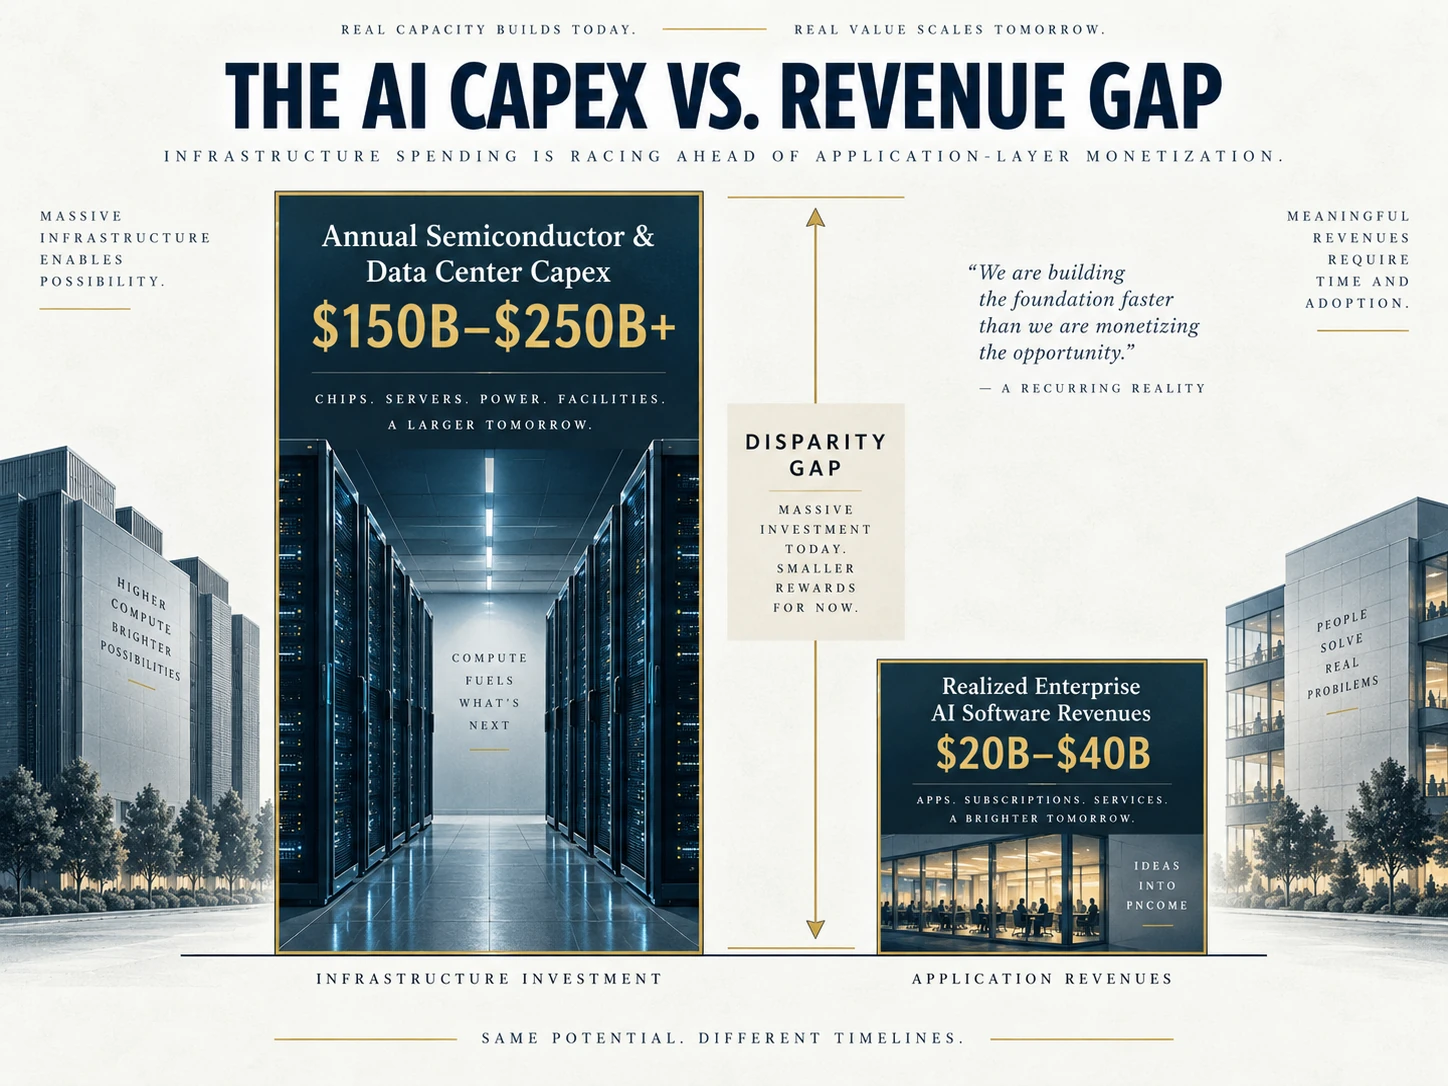
Figure 6: AI infrastructure investment versus monetization. The $150–250 billion and $20–40 billion ranges in the graphic are undated illustrative figures, not verified 2026 estimates. Use the dated company disclosures above for scale. Capex purchases assets used over years; annual revenue is a flow. Their difference is not a measure of losses or return on investment.
Open full-size figure (new tab)Why the AI boom resembles earlier cycles
1. capacity is being built ahead of proven long-term demand
The largest technology companies are ordering chips, reserving electricity, financing data centers, and expanding networks before anyone can know with confidence what equilibrium AI demand will look like five years from now.
This is rational if demand grows rapidly.
It becomes overbuilding if demand, utilization, or pricing disappoints.
That same uncertainty existed with rail miles in 1845 and fiber capacity in 1999.
2. scarcity economics may not survive
The early AI market has benefited from scarcity:
scarce accelerators, scarce frontier models, scarce engineering talent, and scarce high-quality compute capacity.
But scarcity invites investment.
Investment creates supply.
And supply changes economics.
Model performance is already converging. Stanford's 2026 AI Index shows several leading developers clustered closely together on frontier evaluations, increasing competition around price, reliability, distribution, and specialization rather than raw capability alone.
Meanwhile, inference economics have improved extraordinarily quickly. Stanford previously documented that the cost of using a model with roughly GPT-3.5-level benchmark performance fell more than 280-fold between late 2022 and late 2024. Stanford AI Index 2025: Research and development.
That is fantastic technological progress.
But falling unit costs can also mean falling prices.
For investors, that distinction is everything.
3. hardware depreciates rapidly
The infrastructure analogy with fiber has limits.
Fiber installed twenty-five years ago may still carry traffic today.
AI accelerators face rapid technological replacement.
Each new hardware generation can offer better performance per watt, better memory architecture, higher bandwidth, or dramatically better price-performance.
This creates a race between:
utilization, revenue growth, technological obsolescence, and depreciation.
A data center may last decades.
The economic life of the accelerators inside it may be far shorter.
That makes timing exceptionally important.
4. power has become part of the technology stack
The AI boom is increasingly constrained not merely by chips but by electricity.
Data centers are competing for grid connections, gas turbines, transformers, transmission capacity, cooling resources, and land.
The International Energy Agency reports that tighter supplies of turbines, transformers and computing equipment, alongside delayed grid connections, are constraining the expansion. IEA, April 2026.
This matters financially.
Every additional bottleneck increases the capital intensity required to deliver one unit of usable compute.
AI's economics therefore depend not only on model improvement but on the economics of physical infrastructure.
Why this time could actually be different
Historical analogy becomes dangerous when it turns into historical determinism.
There are several important reasons why today's AI build-out may produce better financial outcomes than the telecom boom or railway mania.
Stronger balance sheets
The central investors in AI infrastructure are not speculative telecom operators with weak cash flows.
Microsoft, Alphabet, Amazon, and Meta operate some of the most profitable businesses in corporate history.
Large portions of the AI build-out have therefore been financed from operating cash flows rather than fragile short-term borrowing.
That materially reduces immediate systemic risk.
A bad investment made with excess cash destroys shareholder value.
A bad investment funded with short-term debt can destroy the company.
Those are different outcomes.
Existing distribution
The hyperscalers already own customer relationships.
Microsoft can distribute AI through Office, Azure, GitHub, Windows, and enterprise sales.
Google can integrate AI into Search, Workspace, Android, advertising, and Cloud.
Amazon can monetize AI through AWS and its broader commerce infrastructure.
Meta can deploy models across products with billions of users.
They therefore do not need to build a market from zero.
Distribution can dramatically improve monetization.
Real consumer surplus already exists
AI is not merely infrastructure waiting for an application.
Millions of people already use it.
Companies already pay for it.
Developers already integrate it.
And the economic value received by users may substantially exceed what they currently pay.
Stanford's estimate of roughly $172 billion of annual U.S. consumer surplus illustrates the paradox perfectly: enormous economic value can exist before producers have fully determined how to capture it.
This is evidence for the technological miracle.
It is not yet proof of the investment return.
AI can improve existing businesses without becoming a standalone product
A narrow revenue calculation may miss the most important economics.
If AI increases advertising conversion, improves cloud utilization, reduces customer-service cost, increases software retention, improves developer productivity, or strengthens search engagement, the resulting value may appear inside existing revenue lines.
The monetization pathway may therefore be more indirect than in previous technology cycles.
That strengthens the bull case.
The emerging risk: leverage is moving outward
The strongest argument against systemic comparisons with earlier bubbles has been that the hyperscalers can finance investment internally.
That remains partly true.
But the financing structure is changing.
As the required capital expands, AI infrastructure increasingly involves private credit, project-finance structures, data-center operators, utilities, infrastructure funds, and debt outside the balance sheets of the largest technology firms.
One recent example illustrates the direction of travel. On 18 September 2026, Reuters, citing the Financial Times, reported that about $18 billion of loans tied to the Oracle-leased Project Jupiter data centre were being quoted by syndicate banks at 89–91 cents on the dollar. Those are reported loan quotes, not evidence that the project had defaulted. Reuters report.
This does not prove systemic fragility.
But it changes what investors should monitor.
The central risk may gradually migrate away from highly profitable hyperscalers and into the financial ecosystem building infrastructure around them.
This is historically familiar.
Credit risk often emerges not at the technological center of a boom, but among the leveraged suppliers, developers, financiers, and intermediaries surrounding it.
What would prove the bubble thesis wrong?
A useful thesis should be falsifiable.
The strongest evidence against an AI overinvestment thesis would be a combination of the following developments:
Utilization rises rapidly. New data-center capacity fills as soon as it becomes available.
Revenue scales faster than installed capital. AI-related cloud, software, advertising, and productivity revenues grow faster than depreciation and incremental capital costs.
Margins remain durable despite model competition. Falling inference costs increase usage without destroying pricing power.
Existing distribution produces strong economics. AI meaningfully improves retention, advertising yields, software ARPU, cloud growth, and labor productivity across incumbent platforms.
Hardware obsolescence is offset by productivity gains. New generations of accelerators create enough additional revenue per dollar invested to compensate for short asset lives.
Financing remains conservative. The build-out continues primarily through long-duration capital and internally generated cash flow rather than increasingly fragile leverage.
If those conditions hold, today's spending may later look less like telecom overbuilding and more like an exceptionally aggressive but economically rational expansion of productive capacity.
That possibility must be taken seriously.
What would strengthen the bubble thesis?
The opposite evidence would matter just as much.
Warning signs would include persistent reductions in compute utilization, continued increases in capex without corresponding cash-flow acceleration, worsening returns on invested capital, declining revenue per unit of compute, project-finance stress, increasingly aggressive debt structures, rapid price compression, and large write-downs of technically obsolete hardware.
The most dangerous combination would be:
declining unit economics + rising capital intensity + increasing leverage.
That is the combination that historically converts a technology correction into a financial problem.
The productivity question
The ultimate economic case for AI depends on productivity.
Microeconomic evidence is increasingly convincing.
AI systems have demonstrated meaningful productivity improvements in customer support, software development, marketing, research, and other structured knowledge-work tasks. Stanford's 2026 review reports significant gains in several measurable domains.
The macroeconomic evidence remains less certain.
Daron Acemoglu's task-based analysis estimates that the aggregate productivity effect could be economically meaningful but much smaller than the most aggressive forecasts, in part because the easiest-to-automate tasks may not represent the largest share of economic activity (Acemoglu, 2024).
This distinction resembles earlier technological revolutions.
Electricity existed before factories learned how to reorganize around it.
Computers existed before businesses redesigned workflows around them.
The internet existed before companies discovered cloud computing, social networks, streaming, smartphones, and digital marketplaces.
General-purpose technologies often require complementary organizational innovation before their full productivity impact becomes visible.
The lag does not disprove the technology.
But it matters enormously to investors financing infrastructure today.
Capital has a cost while society learns how to use an invention.
Principles for investors
The historical record suggests several disciplines that are more useful than attempting to declare whether an entire technology is "a bubble."
Separate adoption from value capture
Rapid adoption proves usefulness.
It does not prove pricing power.
Ask who captures the economic surplus.
The model provider?
The chip manufacturer?
The cloud platform?
The application?
The enterprise customer?
Or the consumer?
The most important technology in the value chain is not necessarily the best investment.
Follow ROIC, not the story
Revenue growth is not enough.
Growth becomes valuable only when the incremental capital required to produce it earns an attractive return.
The relevant question is:
How much additional operating profit is produced by each additional dollar of capital?
That is far more informative than asking how quickly AI revenue is growing.
Track depreciation as aggressively as growth
AI is unusually capital intensive for a software-driven technological revolution.
Investors should therefore focus on:
useful hardware life, utilization, replacement cycles, energy costs, networking costs, depreciation schedules, and revenue per unit of installed compute.
A rapidly growing revenue line can still produce weak economics if the capital base required to support it grows even faster.
Watch financing structure, not just valuation
High valuations make markets vulnerable.
Leverage makes financial systems vulnerable.
A correction in richly valued equities can destroy wealth without creating a banking crisis.
Debt transforms price declines into solvency problems.
That is why the migration of AI financing into private credit, infrastructure funds, project finance, utilities, and leveraged data-center operators deserves close attention.
Never confuse a bad investment with a bad technology
This may be the single most important lesson.
Railways were revolutionary.
Railway investors still lost fortunes.
The internet transformed civilization.
Hundreds of internet companies still disappeared.
Both statements can be true simultaneously.
Principles for policymakers
The same distinction matters for governments.
Private investors optimize financial returns.
Societies care about a broader set of outcomes.
Infrastructure that earns mediocre private returns can still generate enormous public benefits through lower costs, increased competition, regional development, productivity, scientific discovery, or new industries.
That creates a difficult policy problem.
Governments should neither assume that private capital will efficiently determine the socially optimal level of infrastructure nor conclude that every strategically important technology deserves unlimited subsidy.
The relevant questions include:
Who bears the downside?
Who captures the upside?
Are risks being hidden in regulated banks or opaque credit structures?
Are electricity and grid costs being transferred to households?
Will infrastructure remain economically useful if the original operator fails?
Does public support create genuine spillovers or merely protect speculative investors?
Technological importance is not a sufficient justification for socializing financial losses.
But financial losses are not sufficient evidence that the infrastructure lacked social value.
The investment discipline matrix
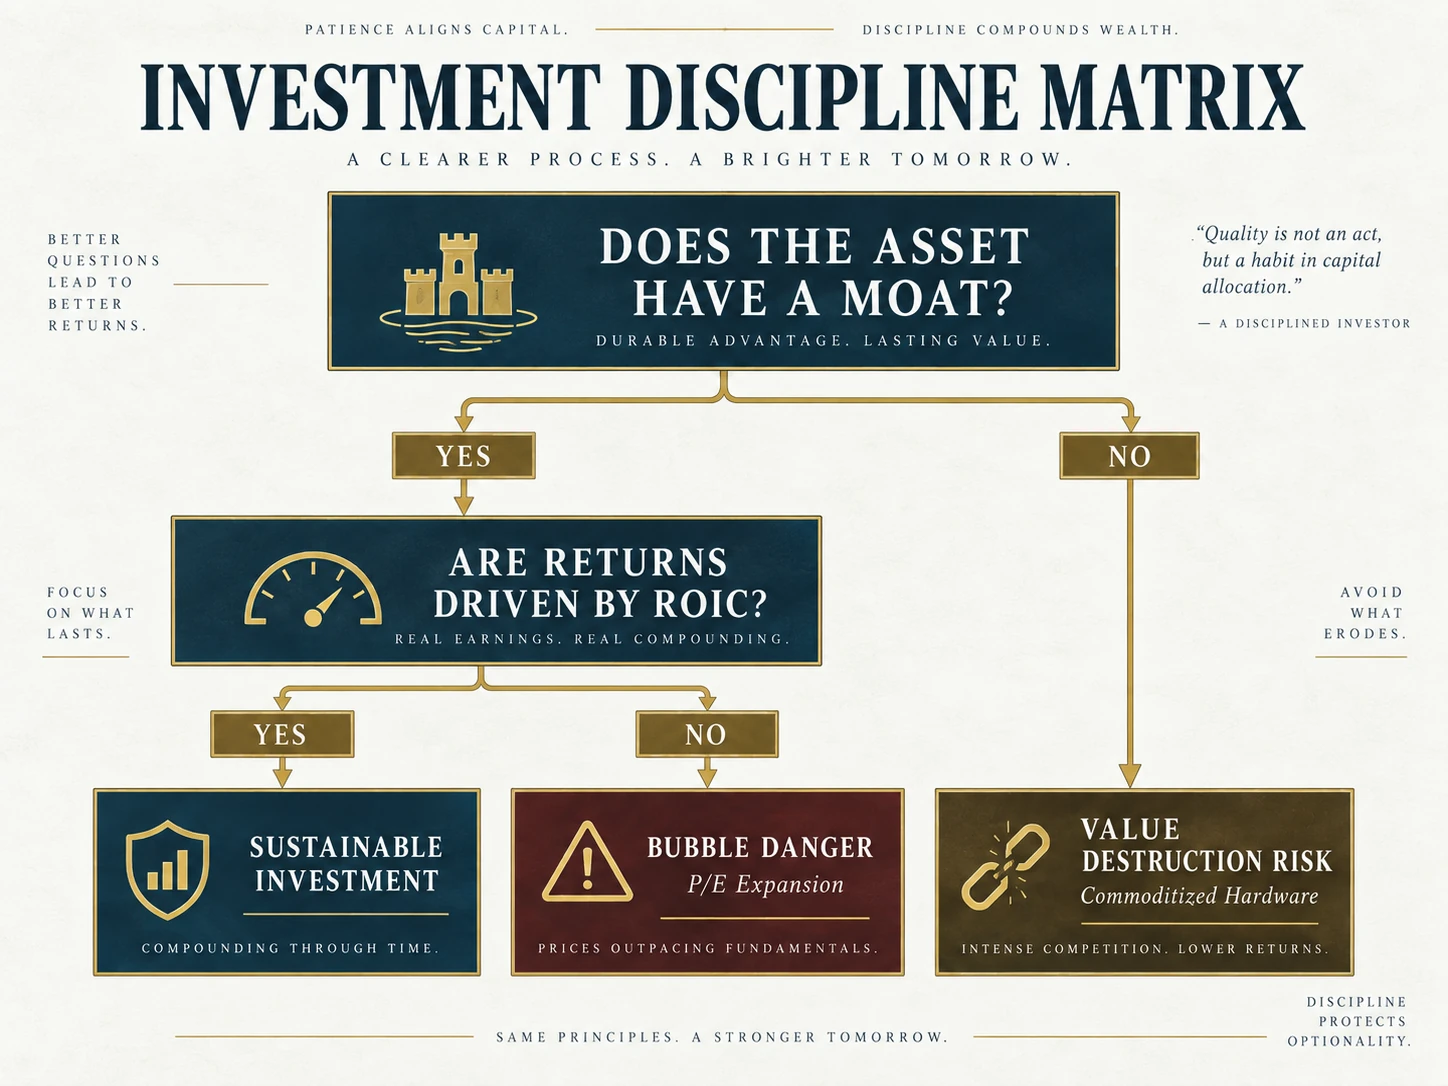
Figure 7: The investment discipline matrix. A research checklist, not a buy-or-sell rule. A moat and attractive ROIC do not guarantee a good investment: valuation, debt, depreciation and the durability of cash flows still matter. The four questions below complete the simplified diagram.
Open full-size figure (new tab)The simplest framework may be to ask four questions.
Does the business possess a durable competitive advantage?
If not, technological growth may primarily benefit customers.
Does additional invested capital produce attractive incremental returns?
If not, revenue growth may conceal value destruction.
How quickly does the underlying asset depreciate economically?
The faster the depreciation, the faster cash flows must arrive.
How is the expansion financed?
Internally financed experimentation can survive disappointment.
Leveraged speculation often cannot.
For a practical way to record these rules before markets become stressful, read the investment mandate.
The objective is not to avoid technological revolutions.
It is to avoid paying revolutionary prices for ordinary economics.
The technology can win while the investor loses
The most dangerous sentence in financial history may indeed be:
"This time is different."
But the opposite statement can be equally dangerous.
History never repeats perfectly.
Railways were different from electricity.
Electricity was different from telecommunications.
The internet was different from AI.
The purpose of financial history is not to predict that every technological revolution must end with the same crash.
It is to recognize recurring economic mechanisms underneath different technologies.
A real breakthrough creates opportunity.
Opportunity attracts capital.
Capital builds capacity.
Capacity creates competition.
Competition changes margins.
And eventually cash flows determine whether the original price paid for that opportunity made sense.
Artificial intelligence already appears to be a genuine technological revolution.
Its capabilities are advancing rapidly. Adoption is widespread. Consumers and businesses are receiving real economic value. Infrastructure is expanding at extraordinary speed.
None of that tells us what today's investments will ultimately return.
The decisive question is not whether AI will change the world.
It probably already has.
The decisive questions are:
Who captures the value?
How durable are the margins?
How much capital is required?
How quickly does that capital depreciate?
And what price are investors paying today for cash flows that may arrive years from now?
The railway boom left Britain with railways.
The electrical boom left the world with power grids and factories.
The telecom bubble left the global economy with fiber.
An AI capital cycle may leave society with an immense global infrastructure of cheap intelligence: data centers, power capacity, chips, models, networks, and automated systems.
That outcome could be transformational for civilization.
It could also produce disappointing returns for a significant share of the capital financing it.
There is no contradiction between those statements.
That is the lesson financial markets repeatedly forget.
The technology can win. Society can win. And the investor can still lose.
References and further reading
-
Acemoglu, D. (2024). The Simple Macroeconomics of AI. NBER Working Paper No. 32487.
-
Acemoglu, D., & Johnson, S. (2023). Power and Progress: Our Thousand-Year Struggle Over Technology and Prosperity. PublicAffairs.
-
Campbell, G., & Turner, J. D. (2012). Dispelling the Myth of the Naive Investor during the British Railway Mania, 1845–1846. Business History Review, 86(1), 3–41.
-
Cassis, Y. (2011). Crises and Opportunities: Six Centuries of Finance and Industry. Oxford University Press.
-
Dalio, R. (2018). Principles for Navigating Big Debt Crises. Greenleaf Book Group.
-
Eichengreen, B. (1992). Golden Fetters: The Gold Standard and the Great Depression, 1919–1939. Oxford University Press.
-
Galbraith, J. K. (1955). The Great Crash, 1929. Houghton Mifflin.
-
Gordon, R. J. (2016). The Rise and Fall of American Growth. Princeton University Press.
-
Greenwood, R., & Nagel, S. (2009). Inexperienced Investors and Bubbles. Journal of Financial Economics, 93(2), 239–258.
-
Kindleberger, C. P., & Aliber, R. Z. (2011). Manias, Panics, and Crashes (6th ed.). Palgrave Macmillan.
-
Malkiel, B. G. (2003). A Random Walk Down Wall Street (8th ed.). W. W. Norton & Company.
-
Minsky, H. P. (1986). Stabilizing an Unstable Economy. Yale University Press.
-
Odlyzko, A. (2010). Collective Hallucinations and Inefficient Markets: The British Railway Mania of the 1840s. Physica A, 389(12), 2490–2498.
-
Ofek, E., & Richardson, M. (2003). DotCom Mania: The Rise and Fall of Internet Stock Prices. The Journal of Finance, 58(3), 1113–1137.
-
Pastor, L., & Veronesi, P. (2006). Was There a Nasdaq Bubble in the Late 1990s? Journal of Financial Economics, 81(1), 61–100.
-
Perez, C. (2002). Technological Revolutions and Financial Capital: The Dynamics of Bubbles and Golden Ages. Edward Elgar.
-
Reinhart, C. M., & Rogoff, K. S. (2009). This Time Is Different: Eight Centuries of Financial Folly. Princeton University Press.
-
Shiller, R. J. (2000). Irrational Exuberance. Princeton University Press.
-
Stanford Institute for Human-Centered Artificial Intelligence. (2025). AI Index Report 2025.
-
Stanford Institute for Human-Centered Artificial Intelligence. (2026). AI Index Report 2026.
-
Temin, P. (1989). Lessons from the Great Depression. MIT Press.
-
White, E. N. (1990). The Stock Market Boom and Crash of 1929 Revisited. Journal of Economic Perspectives, 4(2), 67–83.
-
Reuters. (18 September 2026). Oracle’s $18 billion data center debt under pressure, FT reports. Company disclosures, Stanford report chapters and IEA research are linked at the relevant claims above.
Common questions
Is AI a bubble?
The technology's usefulness does not settle the valuation question. An AI bubble thesis becomes stronger when capital spending and leverage rise while utilization, pricing power and incremental returns disappoint. Durable cash flows and disciplined financing would weaken that thesis.
How is AI different from the dot-com bubble?
Major AI infrastructure investors have established distribution and substantial operating cash flows. AI also already earns revenue. However, accelerators can depreciate faster than fibre, and debt outside the largest firms can still create financing risk.
Why can a successful technology be a poor investment?
Competition may pass much of a technology's value to customers through lower prices. Overbuilding, rapid depreciation, excessive debt or a high purchase price can prevent shareholders from earning attractive returns even when adoption grows.
Can AI capital expenditure be compared directly with annual AI revenue?
No. Capital expenditure purchases assets used over multiple years, while annual revenue measures a flow over one period. Company definitions also differ. The relevant test is whether incremental lifetime cash flows justify the investment and its financing costs.
Sources
- Fire and steam: railway mania · UK Parliament
- RCA and the Roaring Twenties · Finaeon
- AI Index 2026: Economy · Stanford HAI
- AI Index 2025: Research and development · Stanford HAI
- The Simple Macroeconomics of AI · Daron Acemoglu / NBER
- Data centre electricity use and bottlenecks · IEA